
Jan 3, 2026
[Home/History]
[The Dam] [Fishing]
[Birding]
[Wildlife]
[Eutrophication]
[Photo Album]
[Map]
Water Levels & Rainfall
Recent Water Levels (feet below spill level)
Feb 28, 2026: 1.45 (water level periodically artificially lowered since January 3rd storm)
Jan 3, 2026: Spilling (~4 inches above spill level during peak of storm)
Nov 22, 2025: 3.11
Nov 12, 2025: 7.60
Mar 13, 2025: 3.48
Jan 2025: 5.40
Apr 2024: Full/Spilled
Scroll down for historical water level and rainfall information
For Lake Los Carneros to fill each year it seems to need about 16 to 17 inches of rain. The Goleta Fire Station rainfall monitor average is 18.38 inches per year.
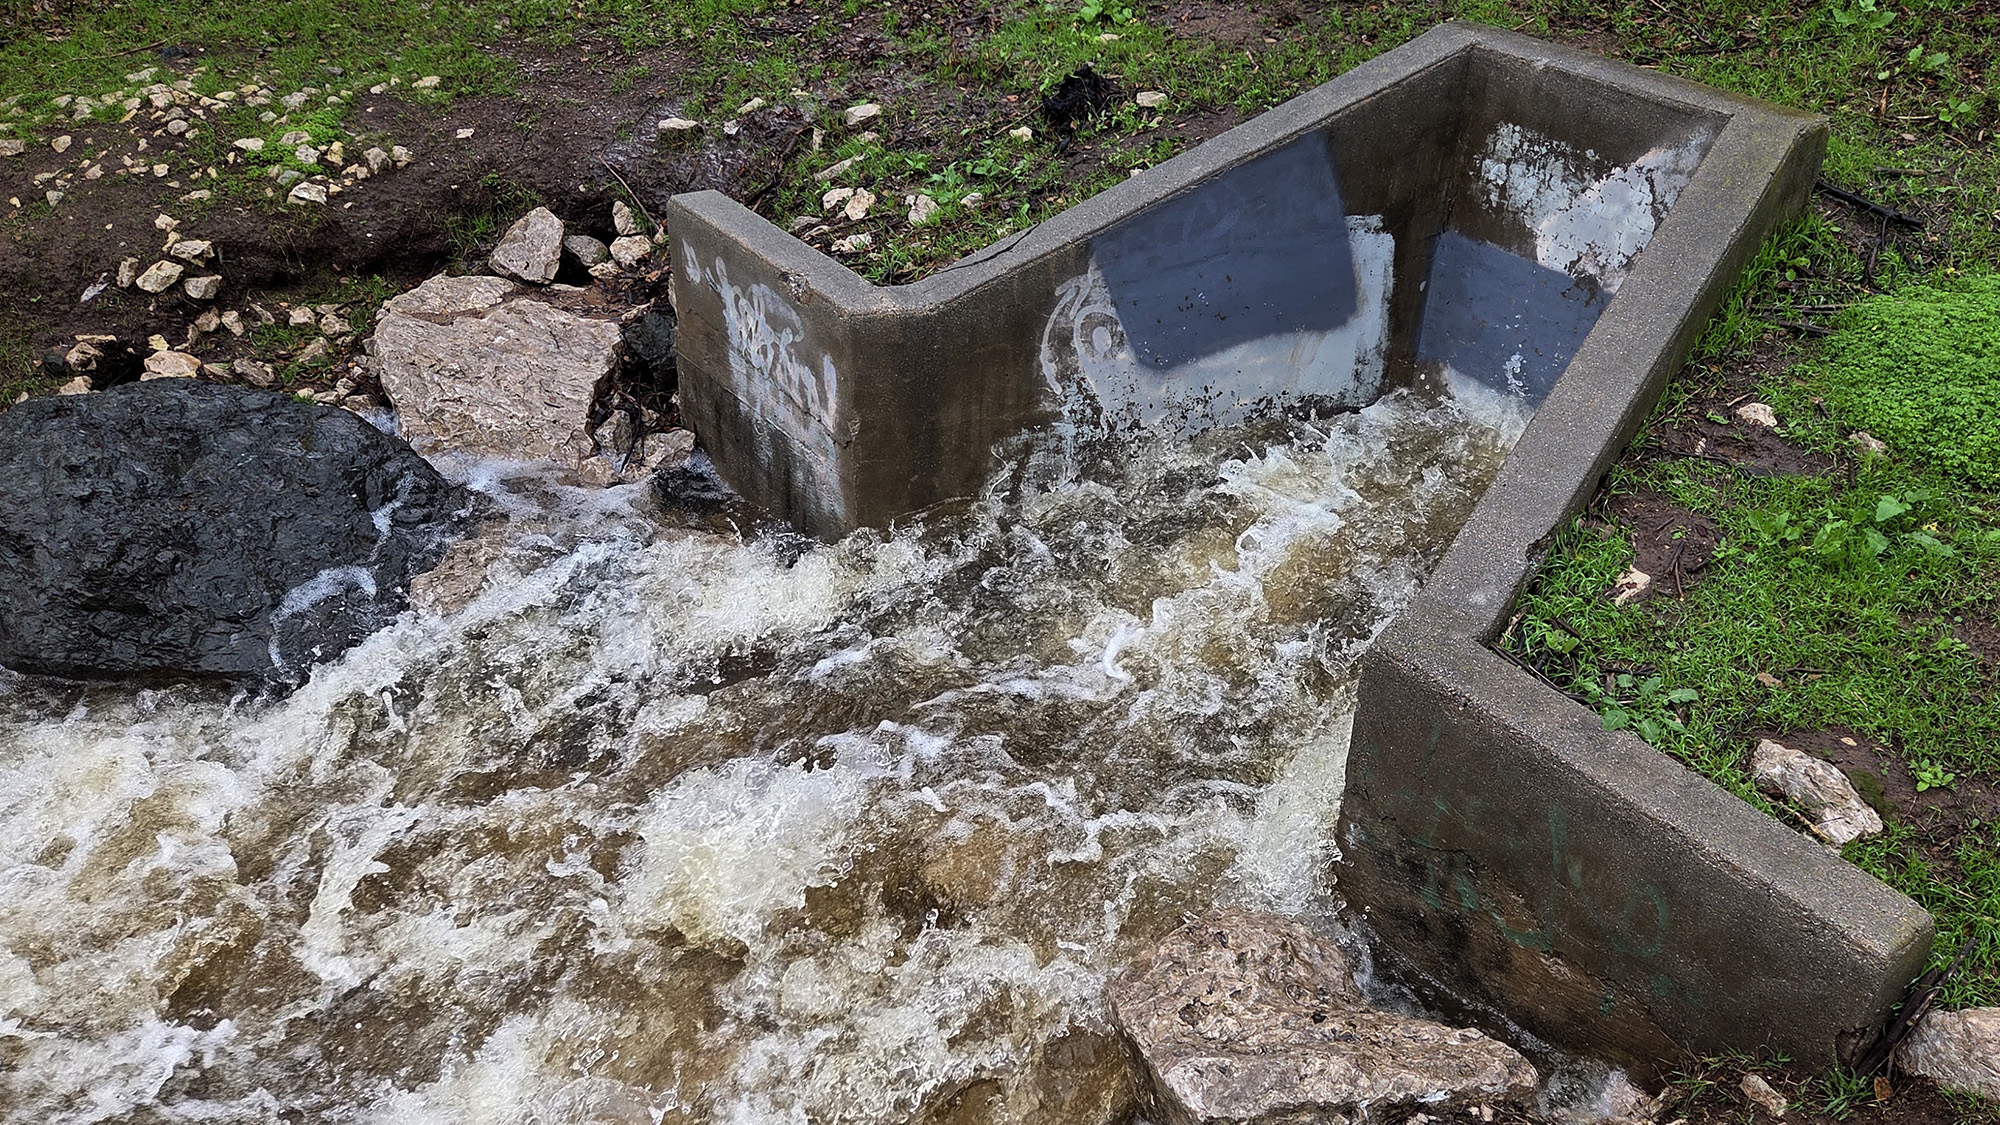
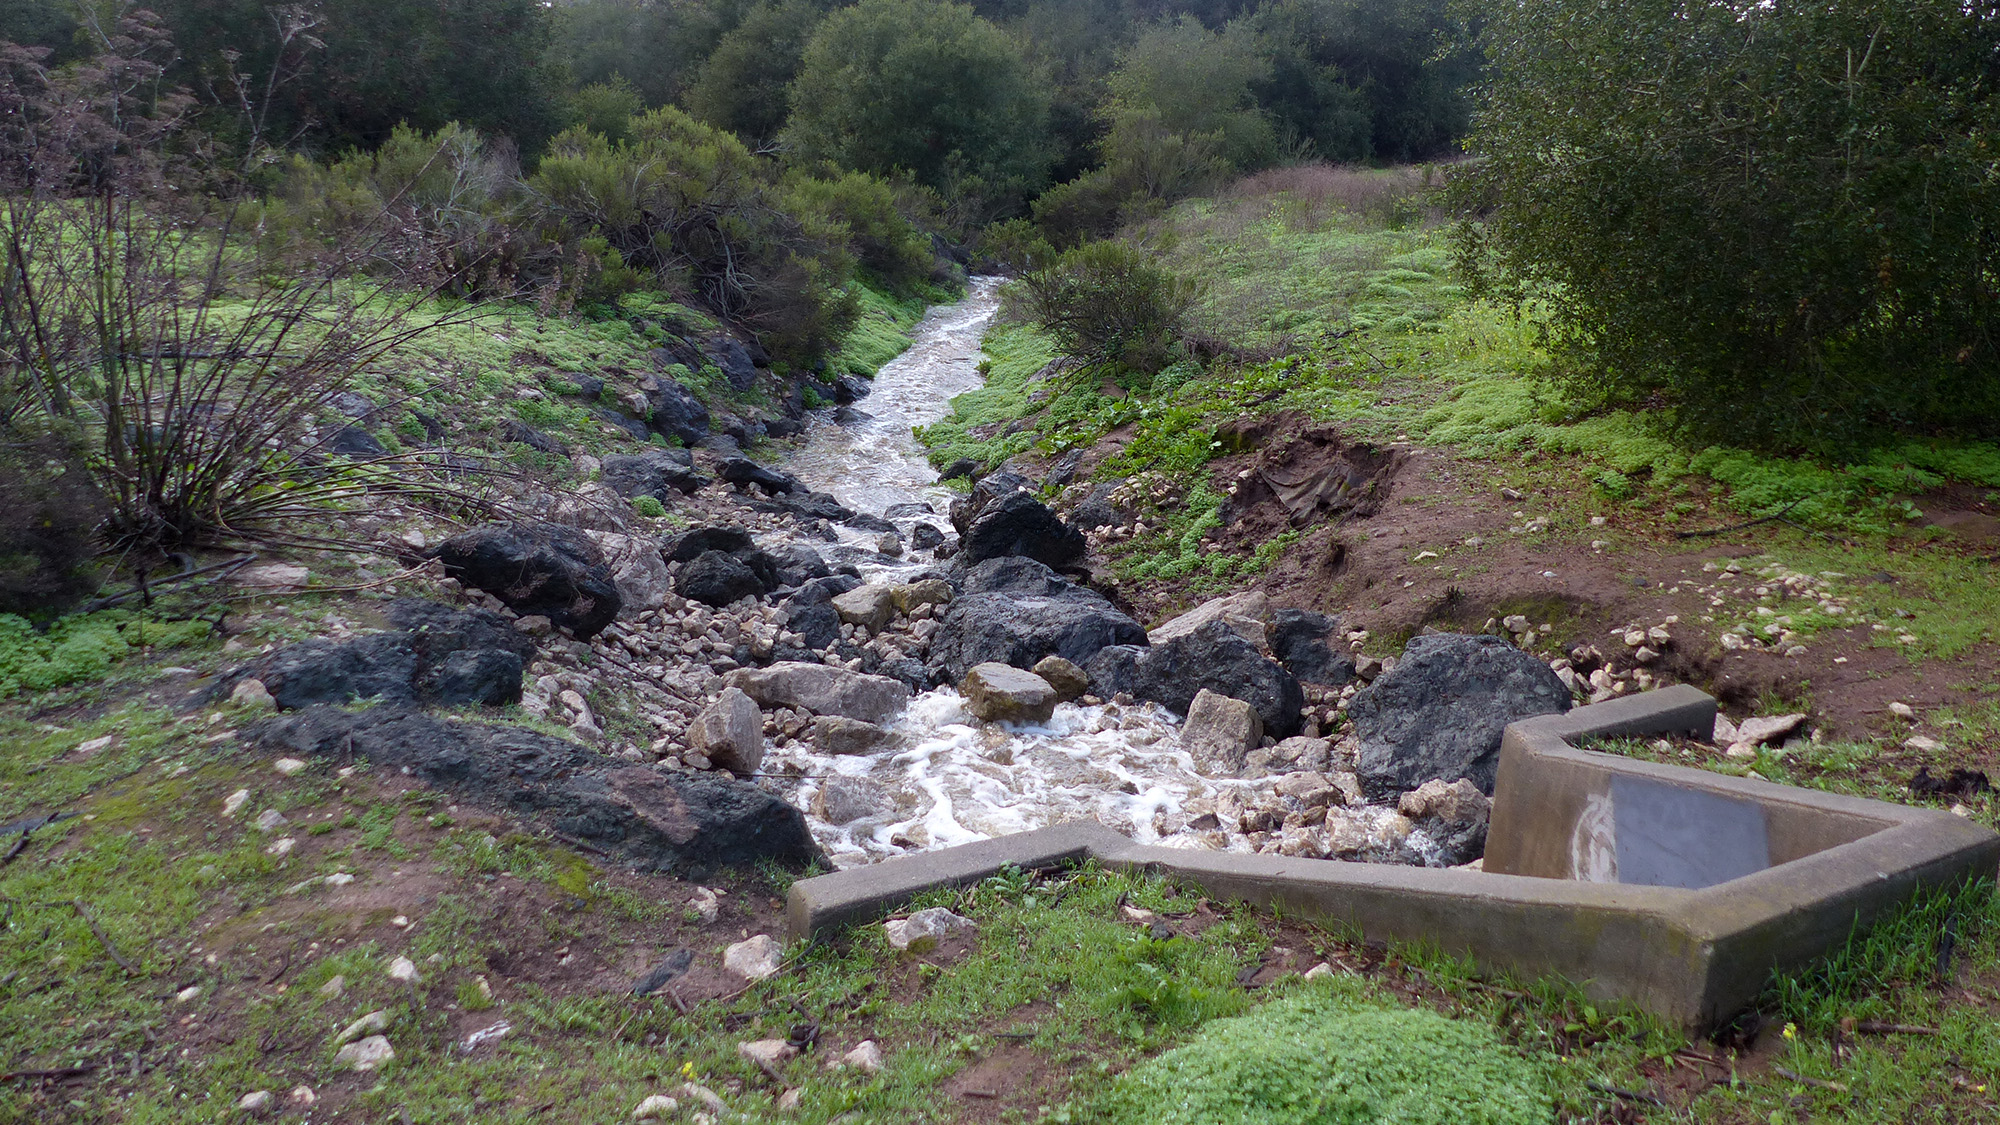
January 3, 2026 - water level ~4 inches above spill level
during peak of storm
(tap on image to view video)
In the early 60's the spillway was added and the lake level was lowered to where it is today. Since then the lake has gone through several multi-year "wet" or "dry" periods. Periods when there is never two years in a row of less than 16 inches of rain and periods when there are never two years in a row of more than 16 inches of rain.
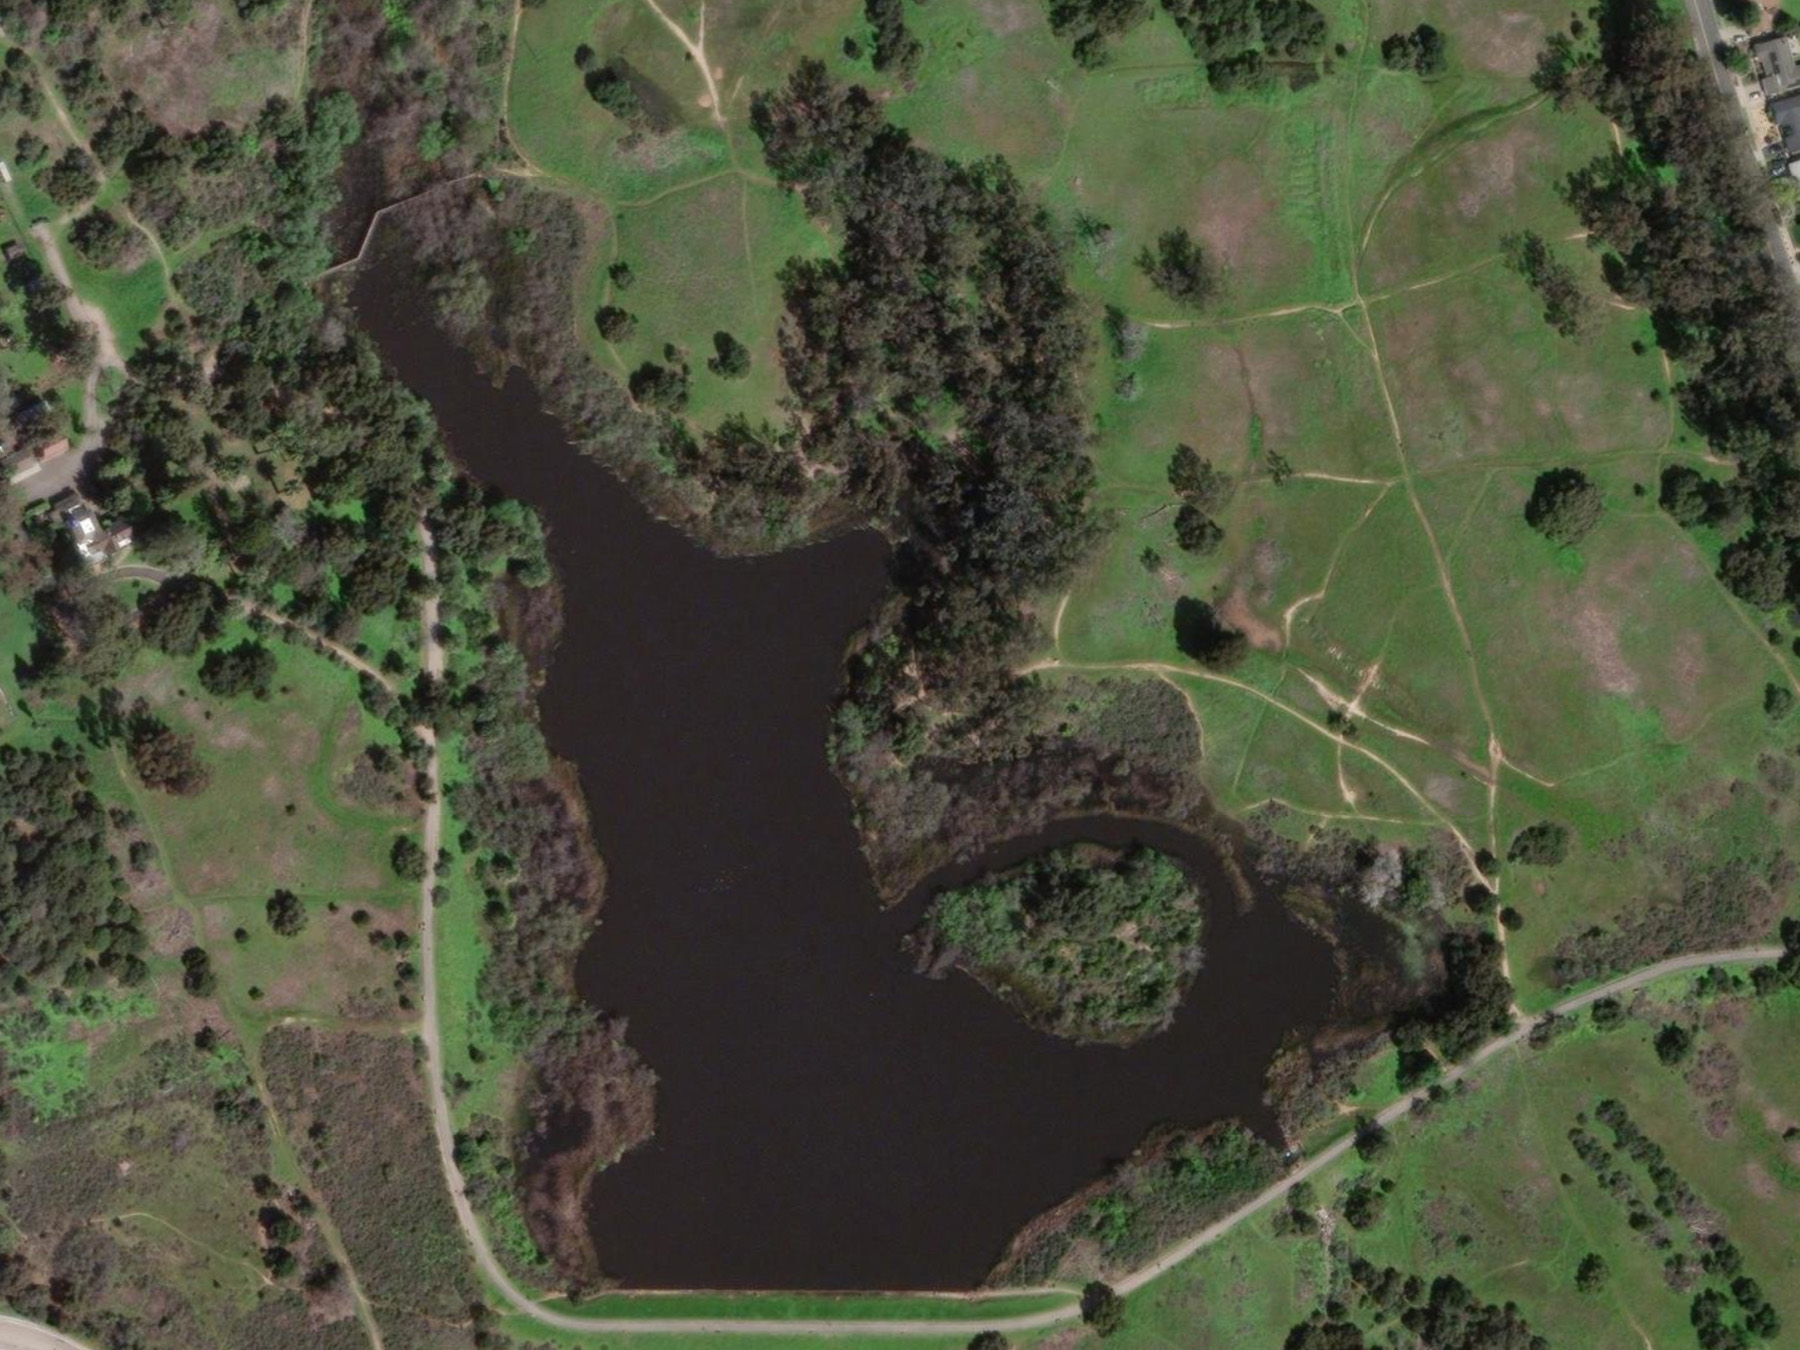
May 2024 - Full
Tap here to download the historical
rainfall totals for the Goleta Fire Station rainfall monitor
(Red highlight indicates years of less than 16 inches of rain.
Green highlight indicates years of 16 inches of rain or more.)
Using 16 inches of rainfall per year as a baseline 1945 through 1954 was mostly "dry". But in 1955 the trend started to change. Except for a three year period of low rain in the late 50s/early 60s and one other in the early 70s from 1955 through 1983 there was never two years in a row of less than 16 inches of rain.
Jan 2023: Lake spills for the first time since 2011
Rainfall records indicate that the lake most likely spilled for three years in a row in 1967 and 1975. And for a historical 6 years in a row from 1978 through 1983. This coincides with the stories I hear of the lake being "healthy" and full most of the time during the 70s.
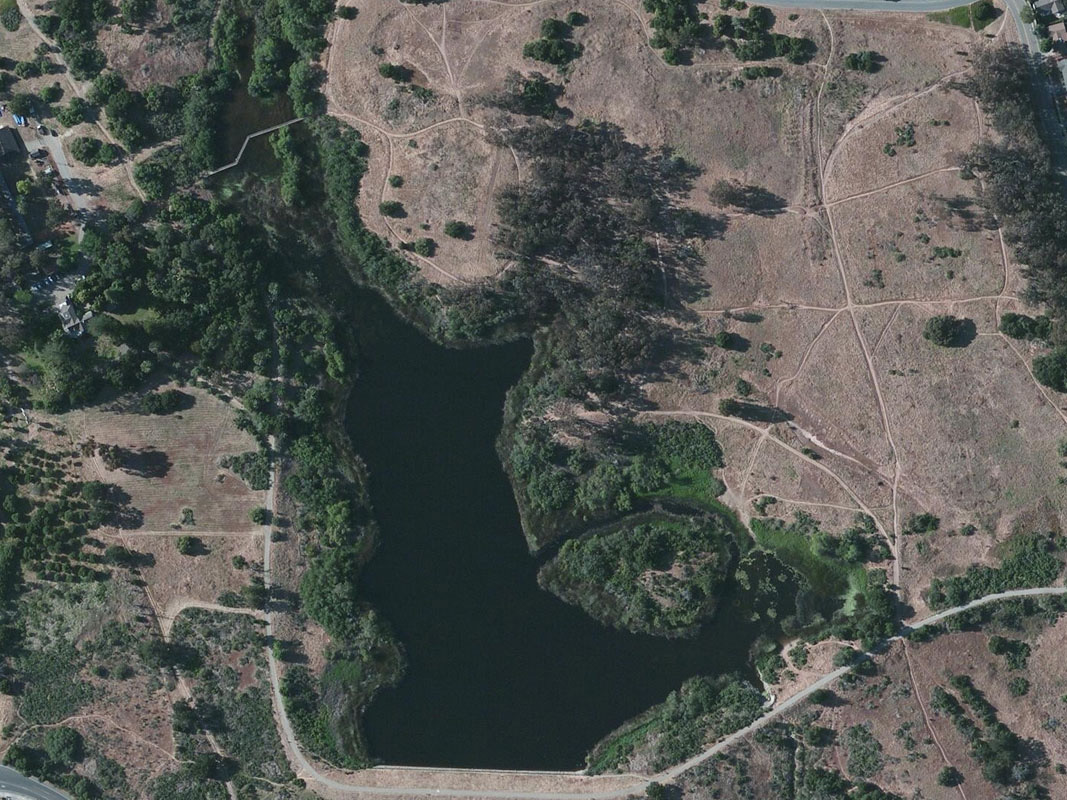
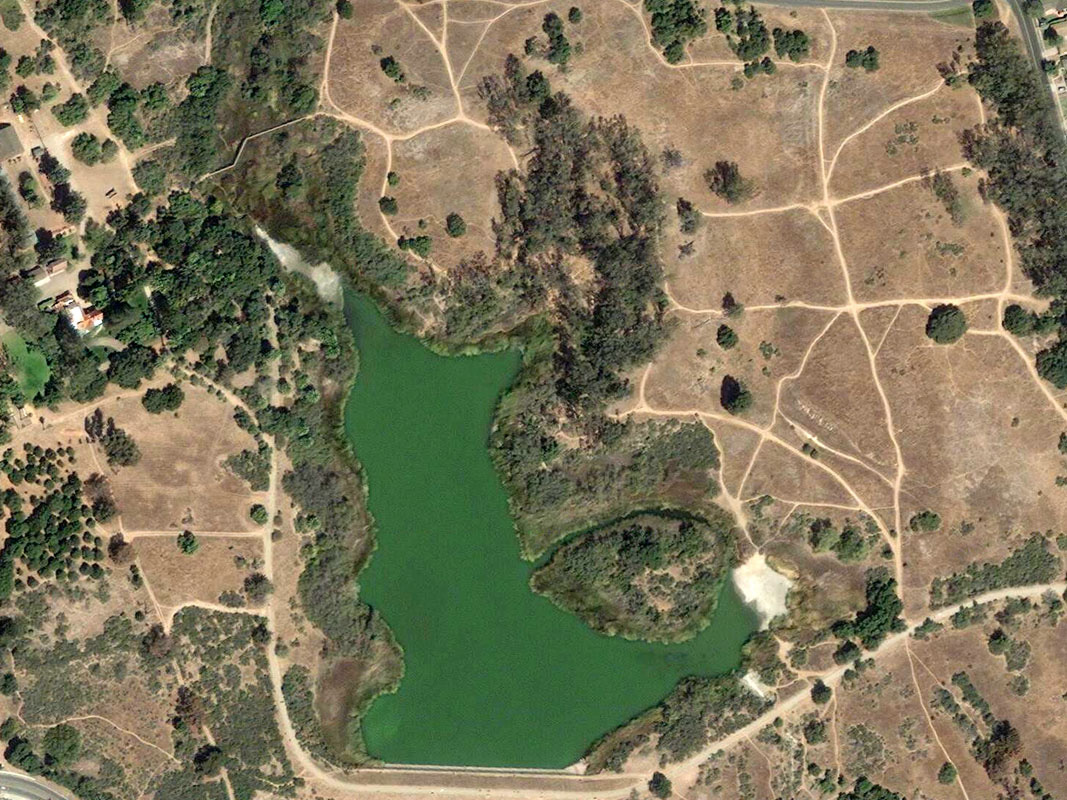
May 2010 - ~3 ft. below spill level
The 80's we entered another period where we did not get two years in a row of enough rain and the lake suffered. In addition, after a historical rainfall year of nearly 50 inches in 1982-1983, the water level was lowered artificially.
Oct 2014: Water level ~12 ft. below spill level
I first visited Lake Los Carneros in the Fall 1983. The water level of the lake was ~12 ft. below spill level and it was the beginning of another dry period.
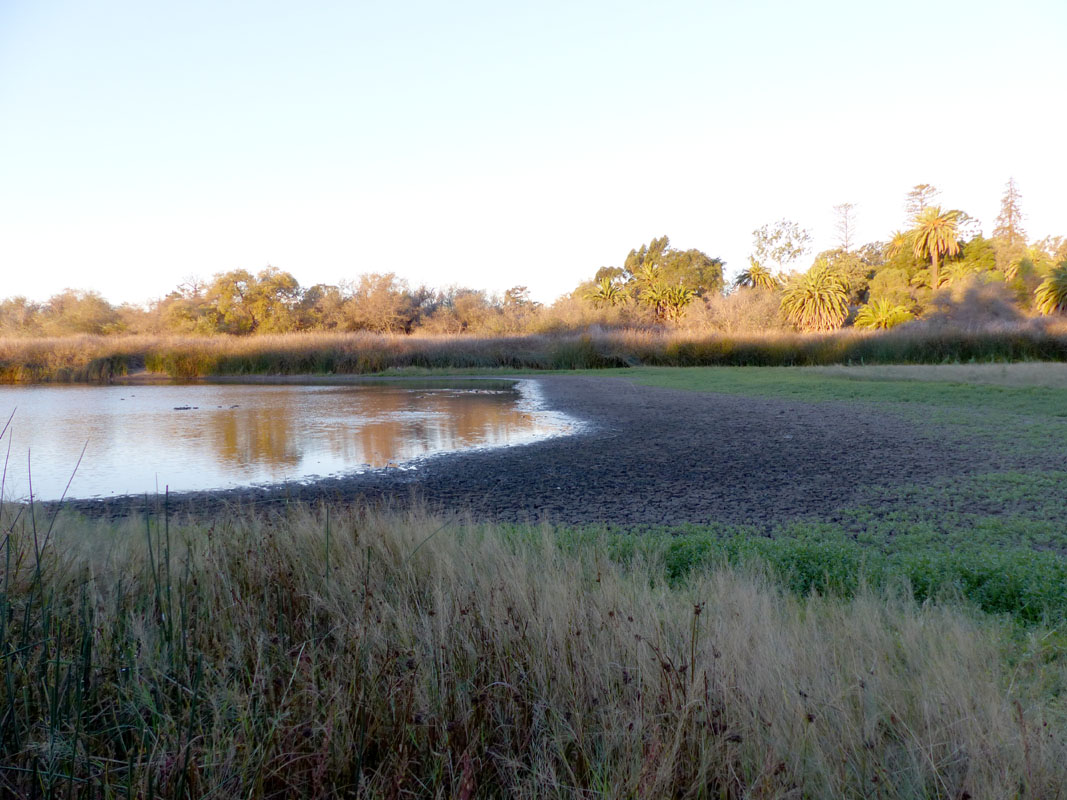
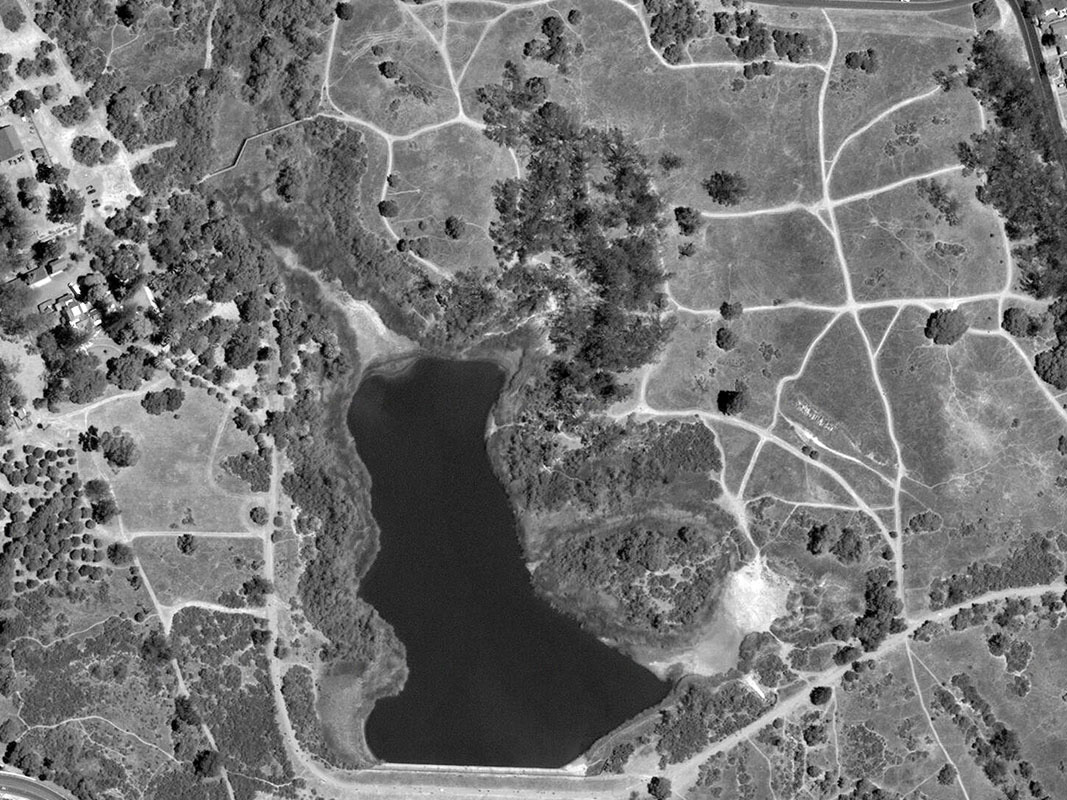
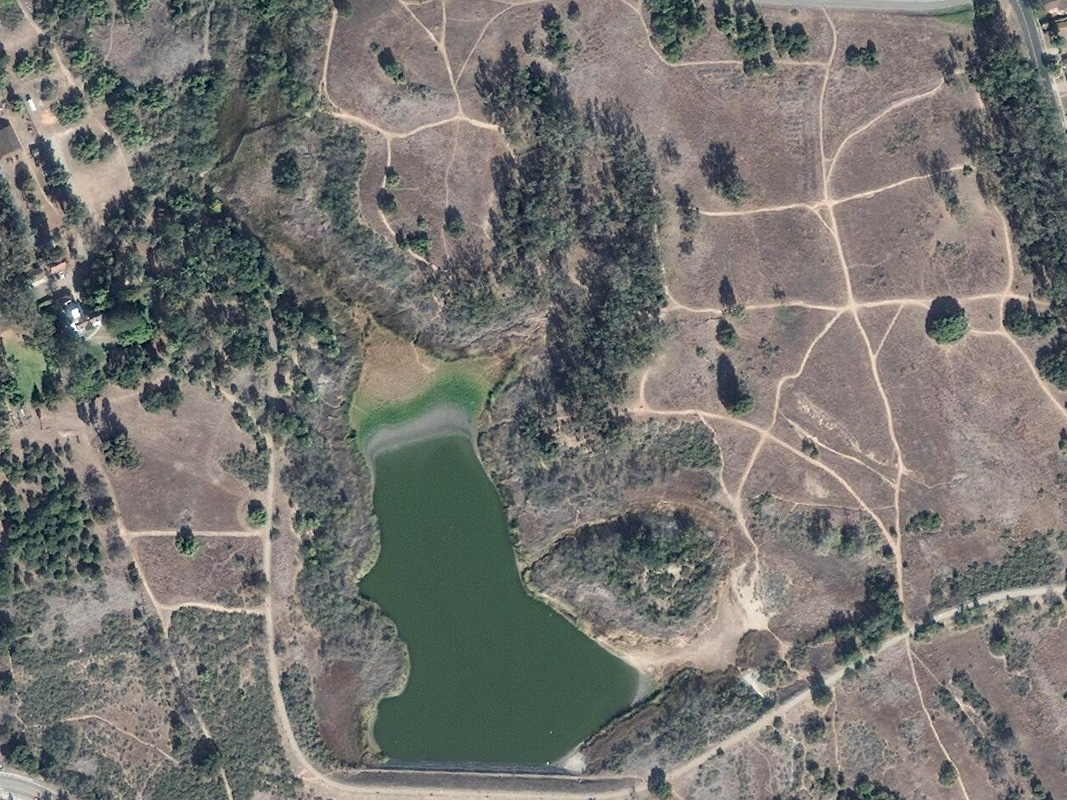
Oct 2015: Nearly a straight line from Frog Beach to Stow Point as the water level reaches ~13.5 ft. below spill level
Oct 2013 - ~9 ft. below spill level
This dry period caused the water level of the lake to drop to over 15 ft. below spill level in early 1991. The "March Miracle" rain of 1991 produced over 12" of rain in one month brought the lake back up a couple of feet from spilling. Although close to spilling in 1992 the lake did not actually spill until 1993.
Mar 1993: Lake spills for the first time since 1983
This wet period continued through 2011. During this period there were only a handful of years of less than 16 inches of rain and there was never more than one year in a row of less than 16 inches of rain. The lake never dropped below ~9 ft below spill level and was relatively healthy. Similar to the stories I heard from the 60s and 70s. Unfortunately this healthy streak ended in 2012.
Jan
2026: First time the lake spills for the third time in four years since 2003
(tap on image to view video)
2012 was the start of another period of low rainfall. Causing the water level of the lake to pass 10 ft. below spill level for the first time in over 20 years. In October of 2014, after four years in a row of low rainfall, the water level dropped to over 11 ft. below spill level. The drain and "The Ledge" were exposed for the first time since the "March Miracle" rains in 1991.
Aug 2014 - ~11 ft. below
spill level
A little over 7 inches of rain in November and December of 2014 provided an additional 3 ft. of fresh water pushing it back up to just a little over 8 ft. below spill level. This combined with another 4.5 inches of rain in 2015 was not enough to keep the water from dropping to a historic ~13 ft. below spill level by the Fall of 2015.
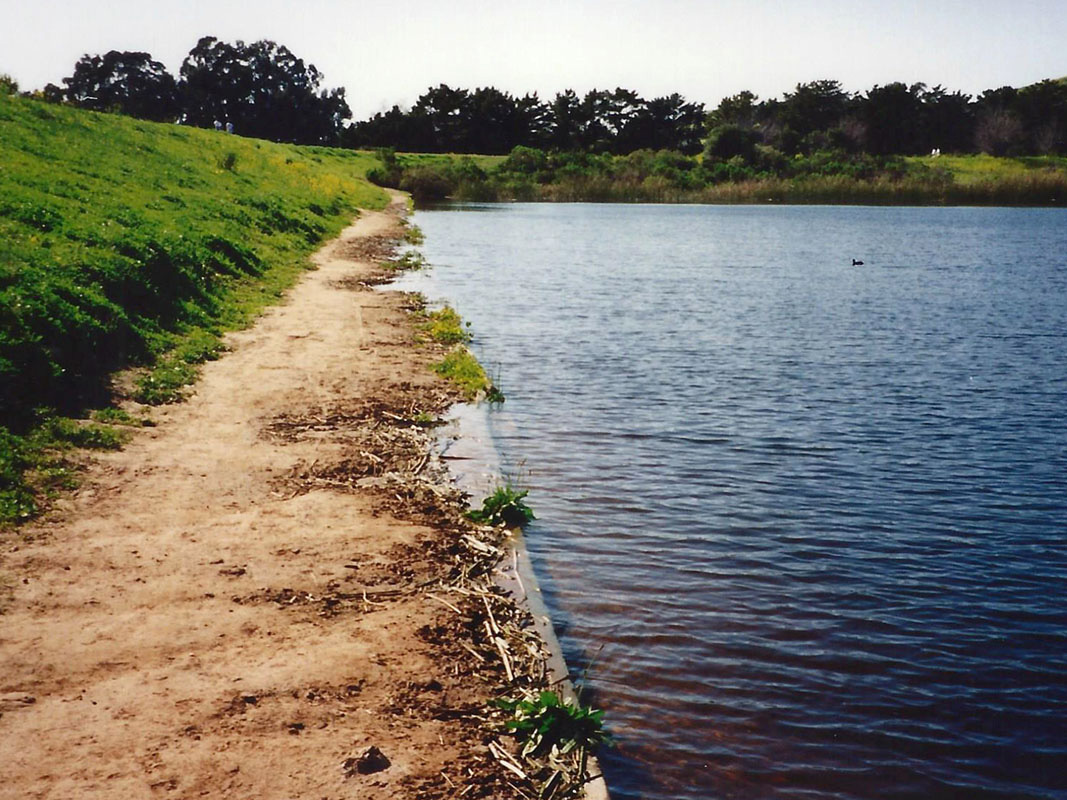
Apr 1993: Lake spills for the first time in over a decade
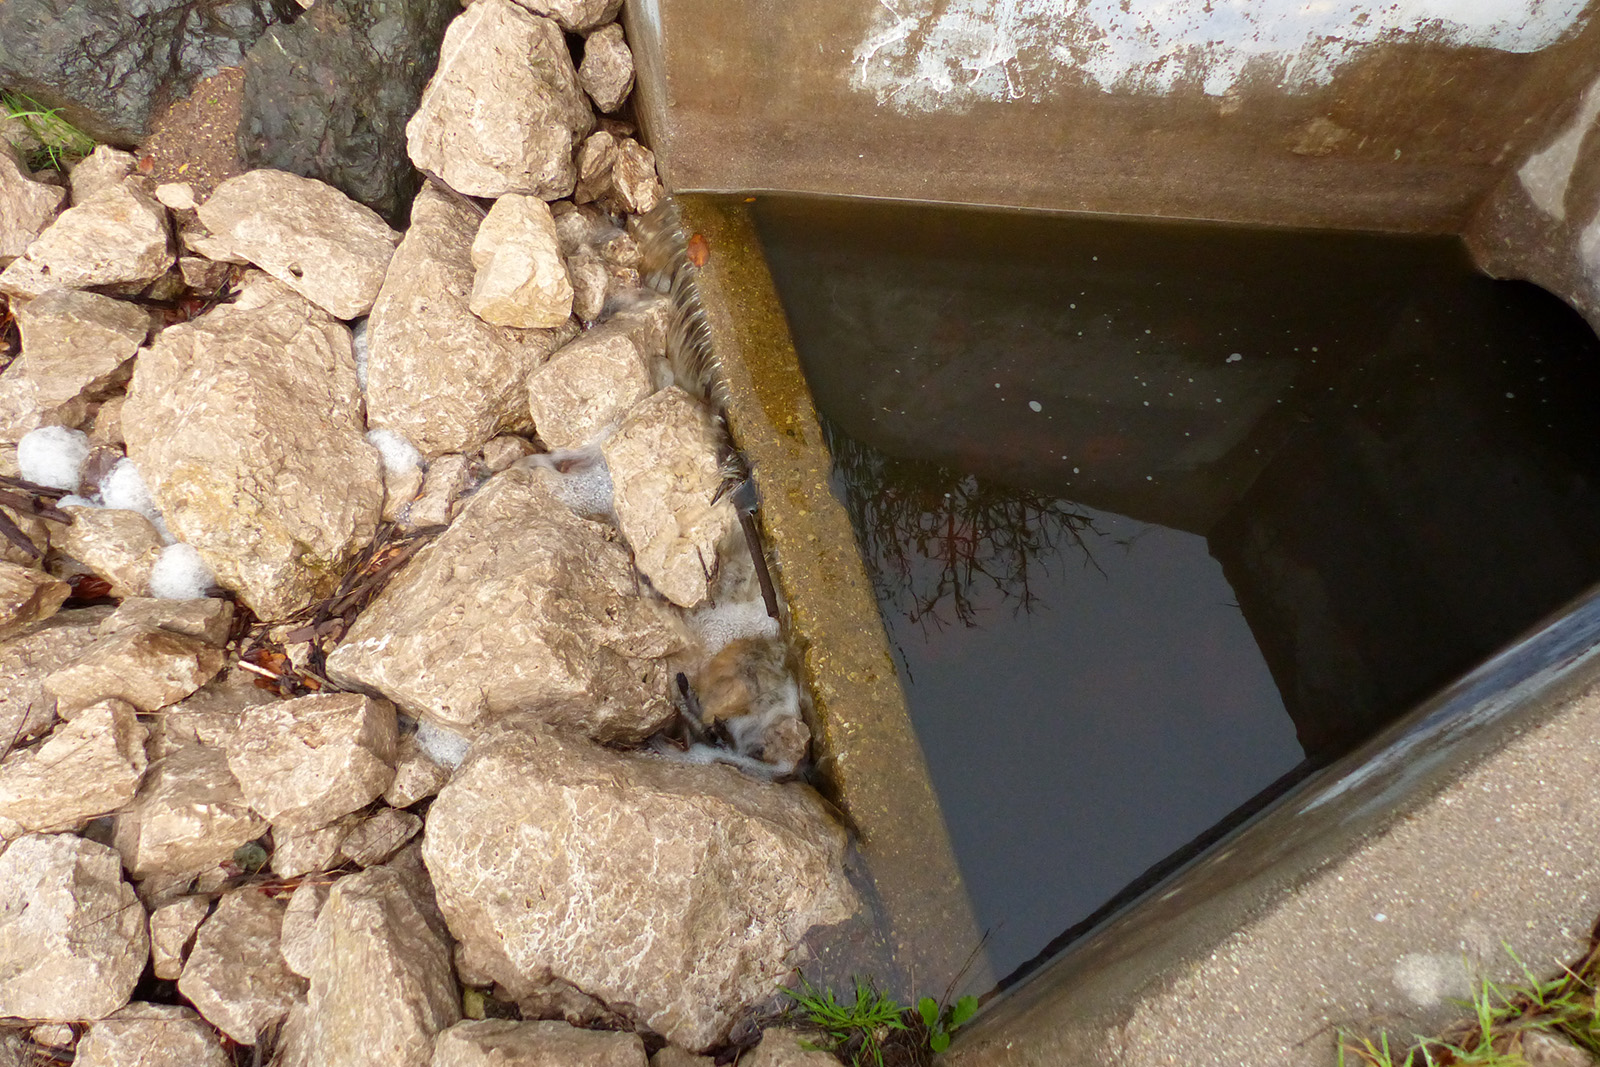
Nov 2014: Spillway completely dry
The water level dropped to over 14 ft. below spill level by December of 2016. Above average rain in February and March of 2017 added nearly 13 feet of water into the lake. Bringing the water level to within a little over a foot from spilling but unfortunately 2018 was another year of below average rainfall. Above average rain in 2019 helped but was was followed by another three years of below average rain.
Nov 2015 - ~14 ft. below spill level
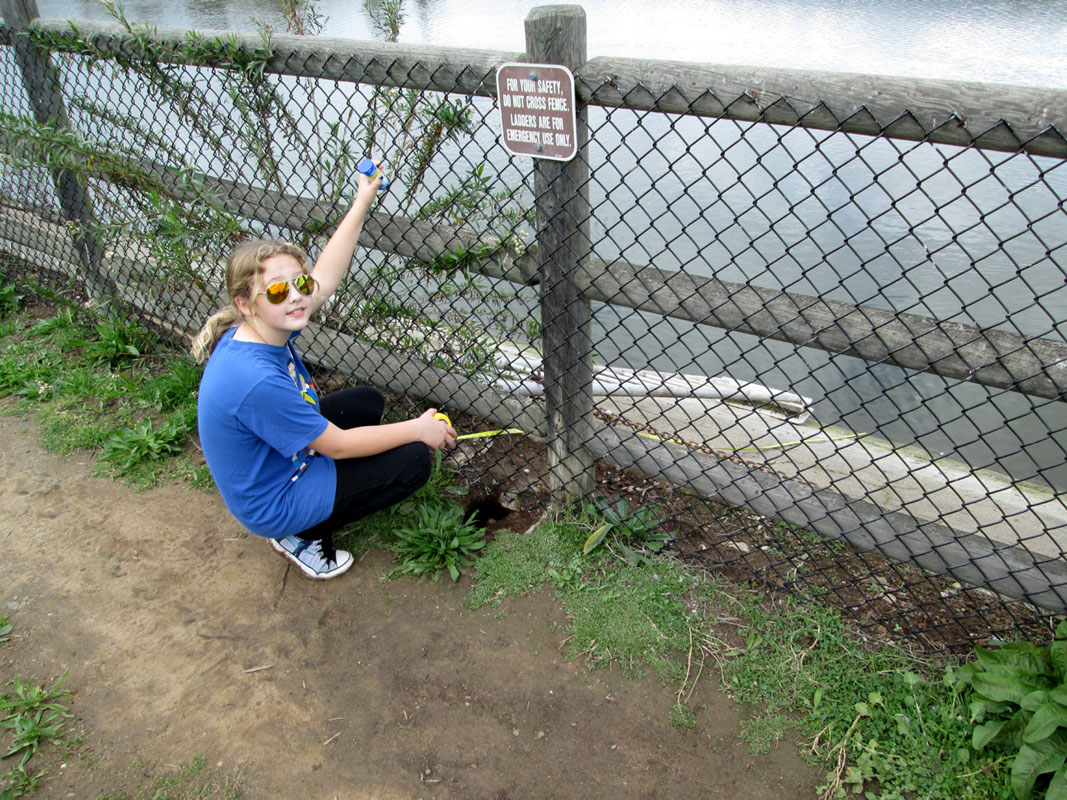
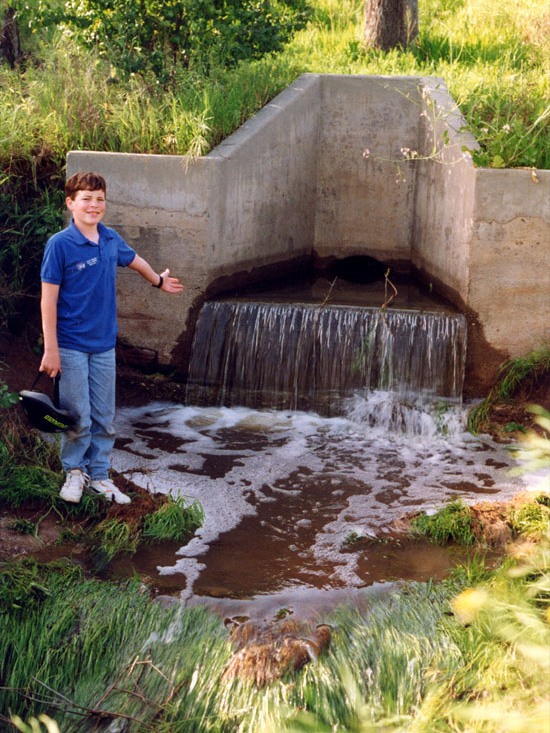
Feb 2015: Measuring the water level between storms
On March 22, 2023 Lake Los Carneros spilled for the first time since 2011.
Another 20+ inches of rain in 2024 caused it to spill again in 2024. The lake
did not spill in 2025 but on January 1, 2026 due to a couple early season storms
the lake spilled. Making it the first time the lake has spilled three times in
four years since 2003.
A couple days later at the peak of another heavy storm the water level rose to
about 4 inches above spill level.
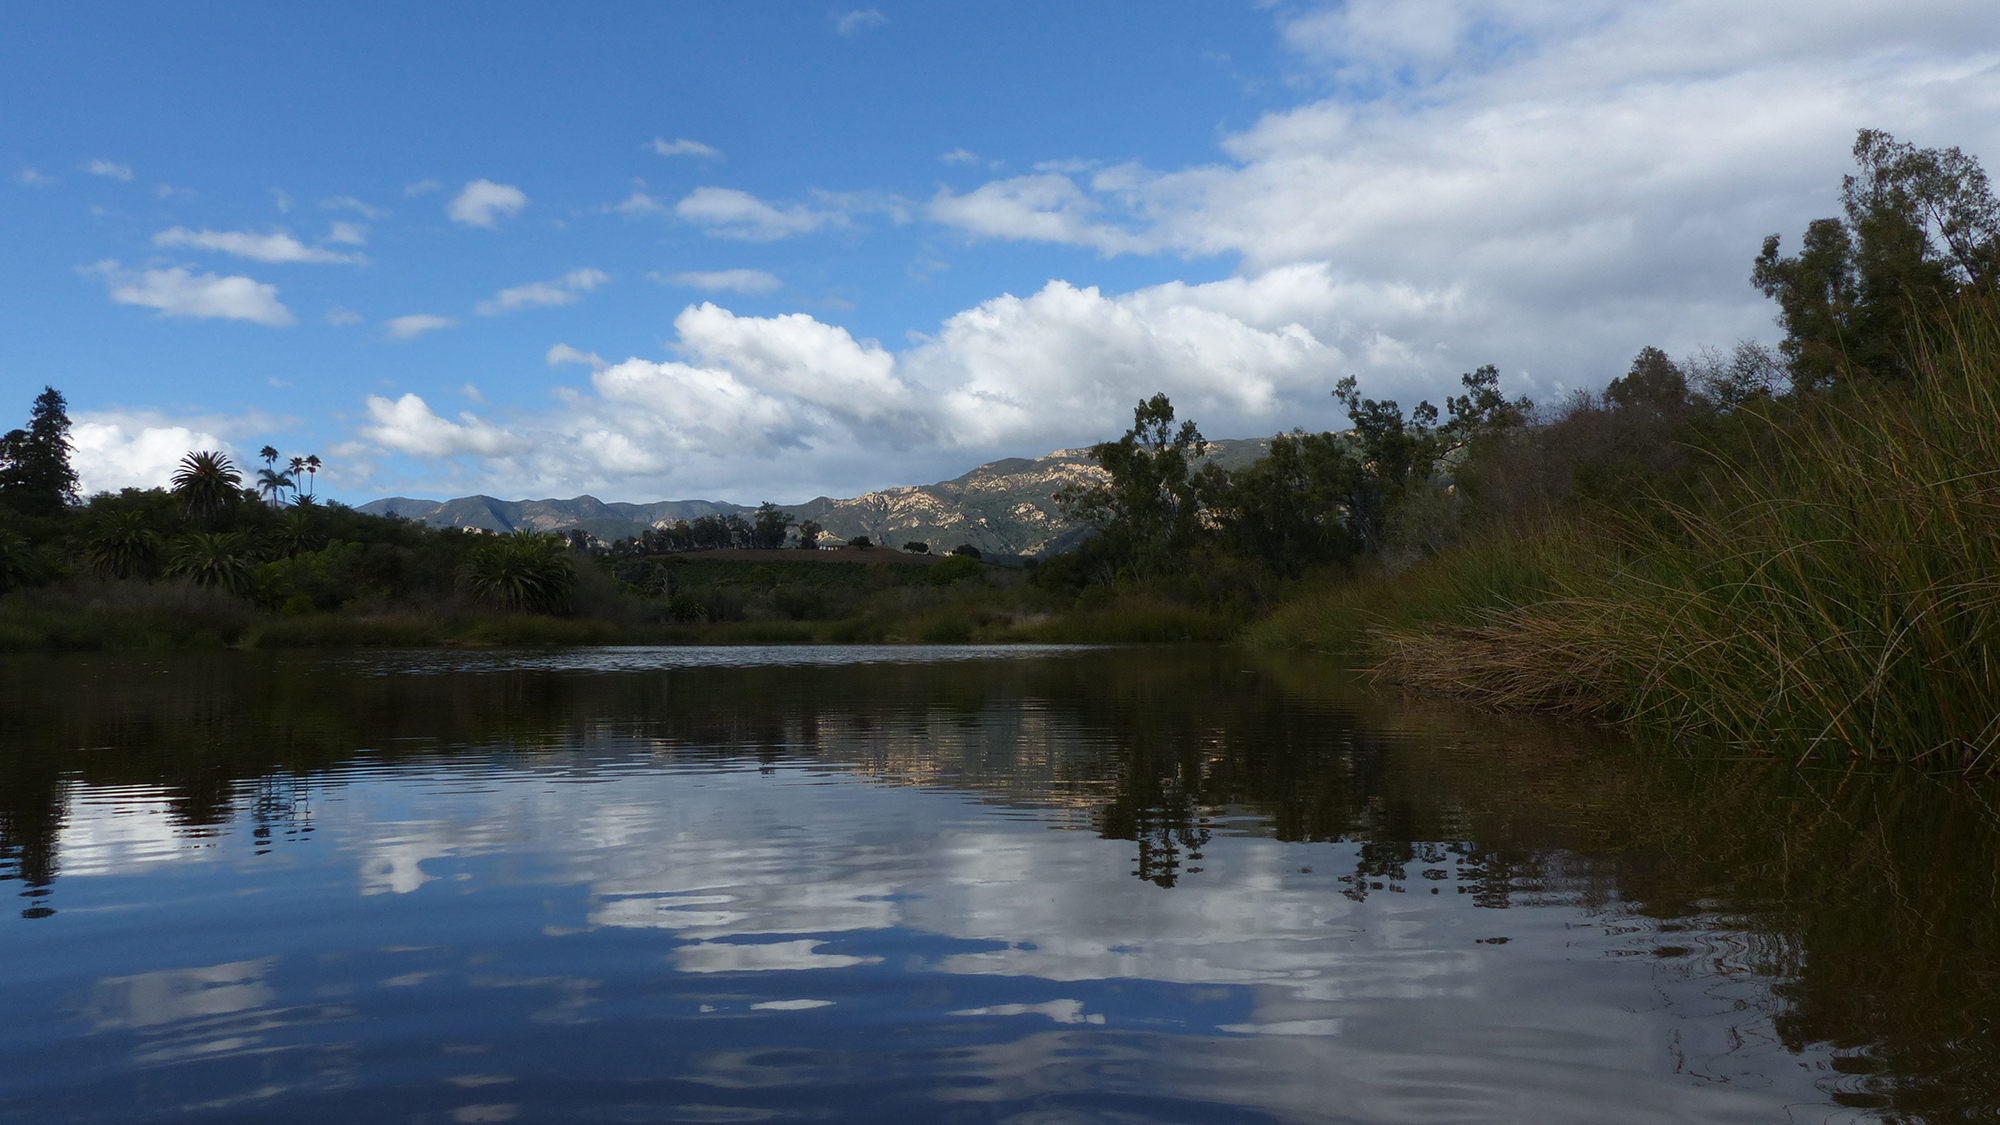
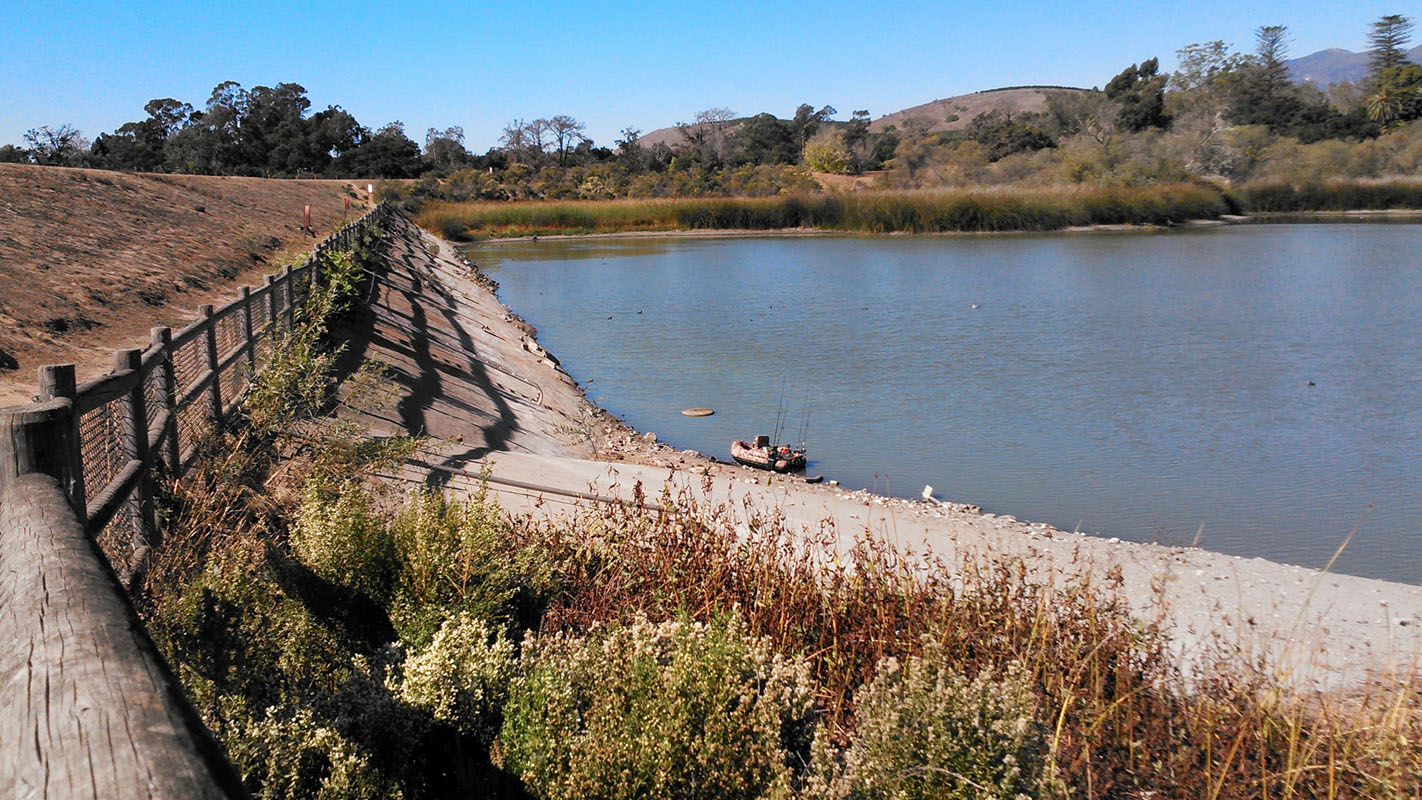
November 2025 - water level ~3 ft. below spill level
July 2014 - ~10 ft. below spill level: The ledge just barely exposed
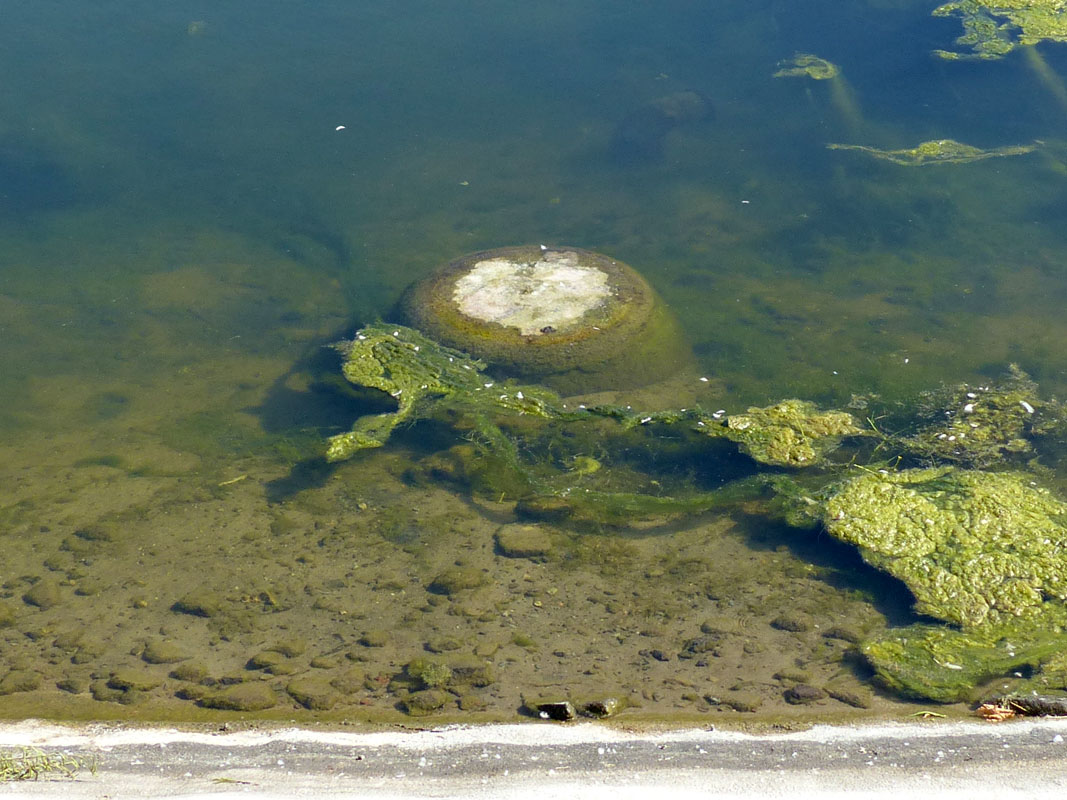
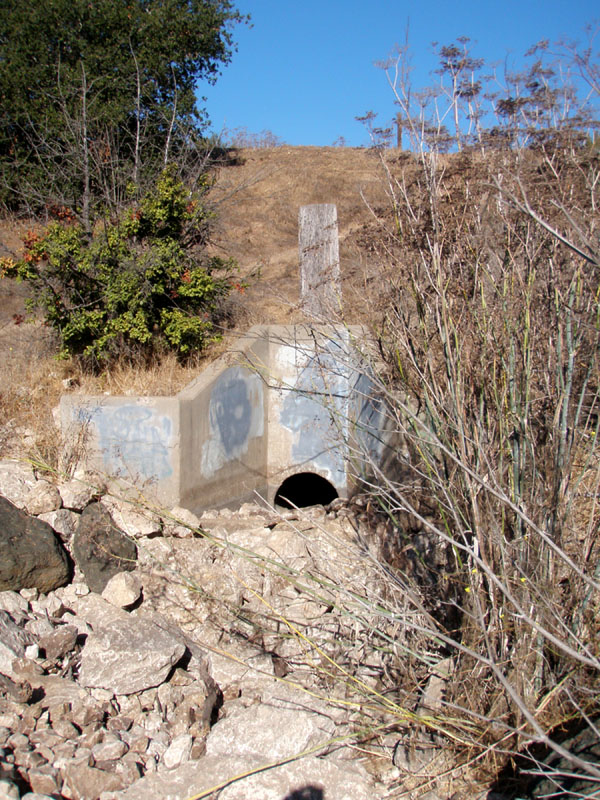
June 2016 - ~12 ft. below spill level: The drain exposed and pipe out beyond the drain visible
January 2016 - ~14 ft. below spill level: The pipe out beyond the drain exposed


Lake Depths
1999 Depth:
~20 ft. (measured using an electronic depth
finder)
2011 Depth:
~19 ft. (measured using a marked rope with
a weight on the end)
Rainfall & Water Levels
Green = Less
than 2 feet below spill level
Red = 10+ feet
below spill level
| Year | Month |
Feet below spill level (approx.) |
| 2026 | February 28 | 1.4* |
| 2026 | January | 0.0 |
| 2025 | November 22 | 3.1 |
| 2025 | November 12 | 7.7 |
| 2025 | October | 7.6 |
| Water Year Rainfall Total: | September 2025 - August 2026 | 22.94" |
| 2025 | July | 6.0 |
| 2025 | April | 3.6 |
| 2025 | January | 5.4 |
| 2024 | October | 4.5 |
| Water Year Rainfall Total: | September 2024 - August 2025 | 10.25" |
| 2024 | July | 2.0 |
| 2024 | April | 0.0 |
| 2024 | January | 0.0 |
| 2023 | October | 7.0 |
| Water Year Rainfall Total: | September 2023 - August 2024 | 25.43" |
| 2023 | July | 5.0 |
| 2023 | April | 3.0* |
| 2023 | January | 0.0 |
| 2022 | October | 5.0 |
| Water Year Rainfall Total: | September 2022 - August 2023 | 32.18" |
| 2022 | July | 10.0 |
| 2022 | March | 9.0 |
| 2022 | January | 8.0 |
| 2021 | October | 9.0 |
| Water Year Rainfall Total: | September 2021 - August 2022 | 11.91" |
| 2021 | July | 9.0 |
| 2021 | April | 6.0 |
| 2021 | January | 8.0 |
| 2020 | October | 7.0 |
| Water Year Rainfall Total: | September 2020 - August 2021 | 9.07" |
| 2020 | July | 6.5 |
| 2020 | April | 5.4 |
| 2020 | February | 6.4 |
| 2020 | January | 6.2 |
| 2019 | December | 6.0 |
| 2019 | November | 7.8 |
| 2019 | October | 7.3 |
| Water Year Rainfall Total: | September 2019 - August 2020 | 14.09" |
| 2019 | July | 5.0 |
| 2019 | April | 2.5 |
| 2019 | March | 2.3 |
| 2019 | January | 7.6 |
| 2018 | November | 11.6 |
| 2018 | October | 10.9 |
| Water Year Rainfall Total: | September 2018 - August 2019 | 24.78" |
| 2018 | July | 9.1 |
| 2018 | April | 6.9 |
| 2018 | March | 6.3 |
| 2018 | January | 8.5 |
| 2017 | October | 7.2 |
| Water Year Rainfall Total: | September 2017 - August 2018 | 9.15" |
| 2017 | July | 5.4 |
| 2017 | April | 3.3 |
| 2017 | February | 1.8 |
| 2017 | January | 11.4 |
| 2016 | December | 15.0 |
| 2016 | October | 14.6 |
| Water Year Rainfall Total: | September 2016 - August 2017 | 25.26" |
| 2016 | July | 12.9 |
| 2016 | April | 10.6 |
| 2016 | March | 10.2 |
| 2016 | January | 14.2 |
| 2015 | October | 13.3 |
| Water Year Rainfall Total: | September 2015 - August 2016 | 11.13" |
| 2015 | July | 11.5 |
| 2015 | April | 9.7 |
| 2015 | March | 8.9 |
| 2015 | January | 9.0 |
| 2014 | October | 12.1 |
| Water Year Rainfall Total: | September 2014 - August 2015 | 11.58" |
| 2014 | July | 10.0 |
| 2014 | April | 8.0 |
| 2014 | March | 7.5 |
| 2014 | February | 9.8 |
| 2014 | January | 9.7 |
| 2013 | October | 9.0 |
| Water Year Rainfall Total: | September 2013 - August 2014 | 6.88" |
| 2013 | July | 7.3 |
| 2013 | April | 5.4 |
| 2013 | February | 4.5 |
| 2013 | January | 5.5 |
| 2012 | November | 6.7 |
| 2012 | October | 6.5 |
| Water Year Rainfall Total: | September 2012 - August 2013 | 11.03" |
| 2012 | July | 4.5 |
| 2012 | April | 3.0 |
| 2012 | January | 3.0 |
| 2011 | October | 4.0 |
| Water Year Rainfall Total: | September 2011 - August 2012 | 13.60" |
| 2011 | July | 2.0 |
| 2011 | April | 0.3 |
| 2011 | January | 0.0 |
| 2010 | October | 5.0 |
| Water Year Rainfall Total: | September 2010 - August 2011 | 31.27" |
| 2010 | July | 3.0 |
| 2010 | May | 1.6 |
| 2010 | April | 2.3 |
| 2010 | January | 5.5 |
| 2009 | October | 8.0 |
| Water Year Rainfall Total: | September 2009 - August 2010 | 21.64" |
| 2009 | July | 6.5 |
| 2009 | April | 4.5 |
| 2009 | March | 3.5 |
| 2009 | January | 4.8 |
| 2008 | December | 6.0 |
| 2008 | October | 5.0 |
| Water Year Rainfall Total: | September 2008 - August 2009 | 11.57" |
| 2008 | July | 3.0 |
| 2008 | April | 1.5 |
| 2008 | January | 6.0 |
| 2007 | October | 8.0 |
| Water Year Rainfall Total: | September 2007 - August 2008 | 17.37" |
| 2007 | July | 6.0 |
| 2007 | April | 4.0 |
| 2007 | January | 4.5 |
| 2006 | October | 7.0 |
| Water Year Rainfall Total: | September 2006 - August 2007 | 7.40" |
| 2006 | July | 5.0 |
| 2006 | April | 3.0 |
| 2006 | January | 5.0 |
| 2005 | October | 4.0 |
| Water Year Rainfall Total: | September 2005 - August 2006 | 23.92" |
| 2005 | July | 2.0 |
| 2005 | April | 0.0 |
| 2005 | January | 0.0 |
| 2004 | October | 5.5 |
| Water Year Rainfall Total: | September 2004 - August 2005 | 38.22" |
| 2004 | July | 3.5 |
| 2004 | April | 1.5 |
| 2004 | January | 2.0 |
| 2003 | October | 3.5 |
| Water Year Rainfall Total: | September 2003 - August 2004 | 10.98" |
| 2003 | July | 1.5 |
| 2003 | April | 0.0 |
| 2003 | January | 2.5 |
| 2002 | October | 7.5 |
| Water Year Rainfall Total: | September 2002 - August 2003 | 23.78" |
| 2002 | July | 5.5 |
| 2002 | April | 3.5 |
| 2002 | January | 2.0 |
| 2001 | October | 4.0 |
| Water Year Rainfall Total: | September 2001 - August 2002 | 9.05" |
| 2001 | July | 1.9 |
| 2001 | April | 0.0 |
| 2001 | January | 4.0 |
| 2000 | October | 4.0 |
| Water Year Rainfall Total: | September 2000 - August 2001 | 24.39" |
| 2000 | July | 1.8 |
| 2000 | April | 0.0 |
| 2000 | January | 7.0 |
| 1999 | October | 7.0 |
| Water Year Rainfall Total: | September 1999 - August 2000 | 22.85" |
| 1999 | July | 5.0 |
| 1999 | April | 3.0 |
| 1999 | January | 4.0 |
| 1998 | October | 3.0 |
| Water Year Rainfall Total: | September 1998 - August 1999 | 11.85" |
| 1998 | July | 1.5 |
| 1998 | April | 0.0 |
| 1998 | February | 0.0 |
| 1998 | January | 1.0 |
| 1997 | October | 7.0 |
| Water Year Rainfall Total: | September 1997 - August 1998 | 47.03" |
| 1997 | July | 5.0 |
| 1997 | April | 3.0 |
| 1997 | January | 1.0 |
| 1996 | October | 4.0 |
| Water Year Rainfall Total: | September 1996 - August 1997 | 18.07" |
| 1996 | July | 2.0 |
| 1996 | April | 0.0 |
| 1996 | February | 0.0 |
| 1996 | January | 1.9 |
| 1995 | October | 3.0 |
| Water Year Rainfall Total: | September 1995 - August 1996 | 17.35" |
| 1995 | July | 1.5 |
| 1995 | April | 0.0 |
| 1995 | January | 0.0 |
| 1994 | October | 6.0 |
| Water Year Rainfall Total: | September 1994 - August 1995 | 38.34" |
| 1994 | July | 4.0 |
| 1994 | April | 2.0 |
| 1994 | January | 4.0 |
| 1993 | October | 4.0 |
| Water Year Rainfall Total: | September 1993 - August 1994 | 13.87" |
| 1993 | July | 1.8 |
| 1993 | April | 0.0 |
| 1993 | January | 2.1 |
| 1992 | October | 7.0 |
| Water Year Rainfall Total: | September 1992 - August 1993 | 28.50" |
| 1992 | July | 5.0 |
| 1992 | April | 3.0 |
| 1992 | January | 4.0 |
| 1991 | October | 7.5 |
| Water Year Rainfall Total: | September 1991 - August 1992 | 19.74" |
| 1991 | July | 6.5 |
| 1991 | April | 4.5 |
| 1991 | February | 15.6 |
| 1991 | January | 15.5 |
| 1990 | October | 15.5 |
| Water Year Rainfall Total: | September 1990 - August 1991 | 18.22" |
| 1990 | July | 14.8 |
| 1990 | April | 13.5 |
| 1990 | January | 12.9 |
| 1989 | December | 13.0 |
| 1989 | October | 12.9 |
| Water Year Rainfall Total: | September 1989 - August 1990 | 7.04" |
| 1989 | July | 11.5 |
| 1989 | April | 9.0 |
| 1989 | January | 6.0 |
| 1988 | October | 7.0 |
| Water Year Rainfall Total: | September 1988 - August 1989 | 9.11" |
| 1988 | July | 4.0 |
| 1988 | April | 3.0 |
| 1988 | January | 2.0 |
| 1987 | October | 6.0 |
| Water Year Rainfall Total: | September 1987 - August 1988 | 14.42" |
| 1987 | July | 4.0 |
| 1987 | April | 3.0 |
| 1987 | January | 5.0 |
| 1986 | October | 4.0 |
| Water Year Rainfall Total: | September 1986 - August 1987 | 11.94" |
| 1986 | August | 5.5 |
| 1986 | July | 4.5 |
| 1986 | April | 2.0 |
| 1986 | January | 10.0 |
| Water Year Rainfall Total: | September 1985 - August 1986 | 22.26" |
| 1985 | October | 14.0 |
| 1985 | July | 12.0 |
| 1985 | April | 10.4 |
| 1985 | January | 9.5 |
| 1984 | October | 14.8 |
| Water Year Rainfall Total: | September 1984 - August 1985 | 14.71" |
| 1984 | July | 13.8 |
| 1984 | April | 12.9 |
| 1984 | January | 10.3 |
| 1983 | November | 13.0 |
| 1983 | October | 12.5* |
| Water Year Rainfall Total: | September 1983 - August 1984 | 15.41" |
| Water Year Rainfall Total: | September 1982 - August 1983 | 47.93" |
*Known occurrences of lake being artificially lowered by opening the drain.
Questions/Comments: pete@lakeloscarneros.com
[Home/History]
[The Dam] [Fishing]
[Birding]
[Wildlife]
[Eutrophication]
[Photo Album]
[Map]